Semi-Annual Report on Foreign Exchange Turnover
October 2009
The Semi-Annual Report on Foreign Exchange Turnover compiles data from 29 financial institutions that are active in the Australian foreign exchange market and is drawn from the Reserve Bank of Australia's monthly turnover survey. The results for October 2009 are presented in the summary tables and charts below.
The main findings of the report are:
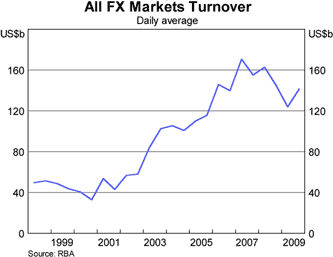
- Total average daily turnover in all foreign exchange instruments in the Australian market was US$141.6 billion in October 2009. This was an increase of 14 per cent from April 2009, and a decline of 2 per cent over the year.
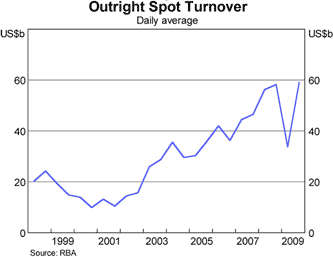
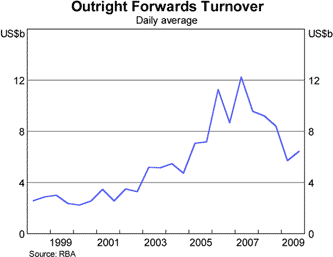
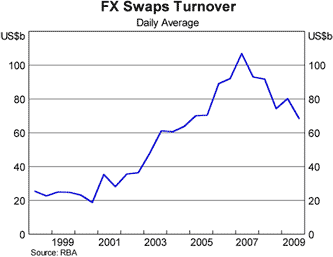
- Average daily turnover in traditional OTC foreign exchange instruments (spot, outright forwards and foreign exchange swaps) in the Australian market was US$134.2 billion in October 2009. This was an increase of 12 per cent from April 2009, and a decline of 5 per cent over the year.
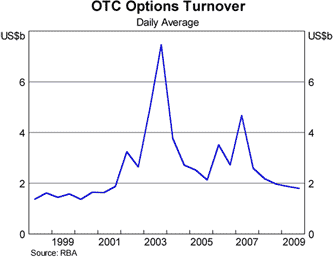
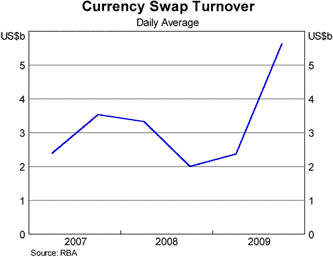
- Average daily turnover in OTC options and cross-currency interest rate swaps (currency swaps) in the Australian market was US$7.4 billion in October 2009. Turnover in OTC options decreased by 4 per cent from April 2009 and by 8 per cent from October 2008. Turnover in currency swaps increased by 137 per cent from April 2009, and by 180 per cent from October 2008.
Tables 1 to 5 report summaries of foreign exchange turnover in the Australian market by instrument, counterparty, currency and maturity for October 2009, with some comparisons to April 2009. Tables 6a to 6c provide the full set of data for October 2009.
For the purposes of this report, turnover is defined as the gross value of all new deals entered into during the month (regardless of whether or not settlement was made during the period) and is reported in terms of the nominal or notional amount of the contracts. Figures reflect all deals struck in Australia, irrespective of where deals are booked (i.e. data are collected on a sales desk basis). As such, survey results are comparable to the Bank for International Settlements (BIS) Triennial survey. All amounts in this report are converted to US dollars using the average AUD/USD exchange rate for the month in which data are collected.
The next semi-annual report will be released in July 2010, presenting data for April 2010. Monthly data for selected series can be accessed at: https://www.rba.gov.au/statistics/tables/index.html#exchange_rates
Similar semi-annual foreign exchange turnover surveys are conducted for a number of foreign exchange markets. The results of these surveys can be found at:
| Canada | http://www.cfec.ca/fx_volume.html |
| Singapore | http://www.sfemc.org/ |
| UK | http://www.bankofengland.co.uk/markets/forex/fxjsc/index.htm |
| US | http://www.newyorkfed.org/fxc |
Similar annual foreign exchange turnover surveys are conducted for the following markets:
| Japan | http://www.fxcomtky.com/index_e.html |
For queries regarding the RBA foreign exchange turnover survey, please contact:
The Senior Analyst
Market Analysis
International Department
Reserve Bank of Australia
Email: turnoversurvey@rba.gov.au
Phone: +61 2 9551 8477
Graphs
 |
|---|
|
|---|
|
|---|
|
|---|
|
|---|
|
|---|